1.4 KiB
1.4 KiB
| stage | group | info |
|---|---|---|
| Monitor | Monitor | To determine the technical writer assigned to the Stage/Group associated with this page, see https://about.gitlab.com/handbook/engineering/ux/technical-writing/#assignments |
Request Profiling (FREE SELF)
To profile a request:
-
Sign in to GitLab as an Administrator or a user with the Maintainer role.
-
In the navigation bar, click Admin area.
-
Go to Monitoring > Requests Profiles.
-
In the Requests Profiles section, copy the token.
-
Pass the headers
X-Profile-Token: <token>andX-Profile-Mode: <mode>(where<mode>can beexecutionormemory) to the request you want to profile. When passing headers, you can use:-
Browser extensions such as the ModHeader Chrome extension.
-
curl. For example:curl --header 'X-Profile-Token: <token>' --header 'X-Profile-Mode: <mode>' "https://gitlab.example.com/group/project"Profiled requests can take longer than usual.
-
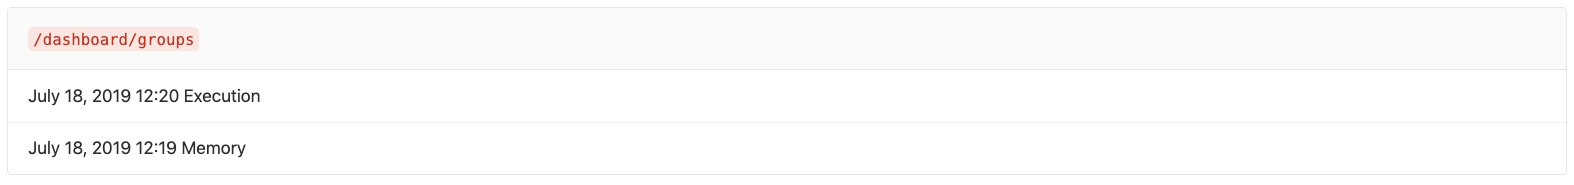
After the request completes, you can view the profiling output from the Monitoring > Requests Profiles administration page:
Cleaning up profiled requests
The output from profiled requests is cleared out once each day through a Sidekiq worker.