4.5 KiB
| stage | group | info | type |
|---|---|---|---|
| Verify | Testing | To determine the technical writer assigned to the Stage/Group associated with this page, see https://about.gitlab.com/handbook/engineering/ux/technical-writing/#designated-technical-writers | reference, howto |
Test Coverage Visualization (CORE ONLY)
- Introduced in GitLab 12.9.
- It's deployed behind a feature flag, disabled by default.
- It's disabled on GitLab.com.
- It can be enabled or disabled per-project.
- To use it in GitLab self-managed instances, ask a GitLab administrator to enable it. (CORE ONLY)
CAUTION: Caution: This feature might not be available to you. Check the version history note above for details.
With the help of GitLab CI/CD, you can collect the test coverage information of your favorite testing or coverage-analysis tool, and visualize this information inside the file diff view of your merge requests (MRs). This will allow you to see which lines are covered by tests, and which lines still require coverage, before the MR is merged.
How test coverage visualization works
Collecting the coverage information is done via GitLab CI/CD's artifacts reports feature. You can specify one or more coverage reports to collect, including wildcard paths. GitLab will then take the coverage information in all the files and combine it together.
For the coverage analysis to work, you have to provide a properly formatted
Cobertura XML report to
artifacts:reports:cobertura.
This format was originally developed for Java, but most coverage analysis frameworks
for other languages have plugins to add support for it, like:
- simplecov-cobertura (Ruby)
- gocover-cobertura (Golang)
Other coverage analysis frameworks support the format out of the box, for example:
- Istanbul (JavaScript)
- Coverage.py (Python)
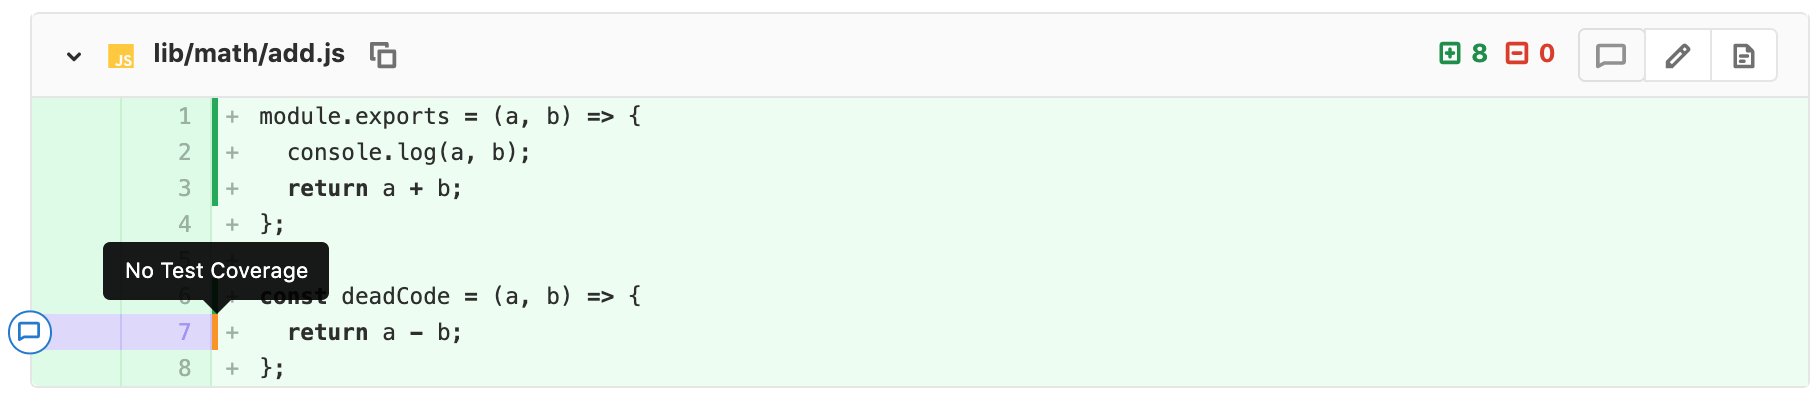
Once configured, if you create a merge request that triggers a pipeline which collects coverage reports, the coverage will be shown in the diff view. This includes reports from any job in any stage in the pipeline. The coverage will be displayed for each line:
covered(green): lines which have been checked at least once by testsno test coverage(orange): lines which are loaded but never executed- no coverage information: lines which are non-instrumented or not loaded
Hovering over the coverage bar will provide further information, such as the number of times the line was checked by tests.
NOTE: Note:
The Cobertura XML parser currently does not support the sources element and ignores it. It is assumed that
the filename of a class element contains the full path relative to the project root.
Example test coverage configuration
The following gitlab-ci.yml example uses Mocha
JavaScript testing and NYC coverage-tooling to
generate the coverage artifact:
test:
  script:
    - npm install
    - npx nyc --reporter cobertura mocha
  artifacts:
    reports:
      cobertura: coverage/cobertura-coverage.xml
Enabling the feature
This feature comes with the :coverage_report_view feature flag disabled by
default. It is disabled on GitLab.com. This feature is disabled due to some performance issues with very large
data sets. When the performance issue
is resolved, the feature will be enabled by default. GitLab administrators with access to the GitLab Rails console
can enable it for your instance. Test coverage visualization can be enabled or disabled per-project.
To enable it:
# Instance-wide
Feature.enable(:coverage_report_view)
# or by project
Feature.enable(:coverage_report_view, Project.find(<project id>))
To disable it:
# Instance-wide
Feature.disable(:coverage_report_view)
# or by project
Feature.disable(:coverage_report_view, Project.find(<project id>))