2.5 KiB
2.5 KiB
| type | stage | group | info |
|---|---|---|---|
| reference | Manage | Optimize | To determine the technical writer assigned to the Stage/Group associated with this page, see https://about.gitlab.com/handbook/engineering/ux/technical-writing/#assignments |
Contribution Analytics (PREMIUM)
Introduced in GitLab 12.2 for subgroups.
With Contribution Analytics, you can get an overview of the contribution events in your group.
- Analyze your team's contributions over a period of time.
- Identify opportunities for improvement with group members who may benefit from additional support.
View Contribution Analytics
To view Contribution Analytics:
- On the top bar, select Menu > Groups and find your group.
- On the left sidebar, select Analytics > Contribution.
Using Contribution Analytics
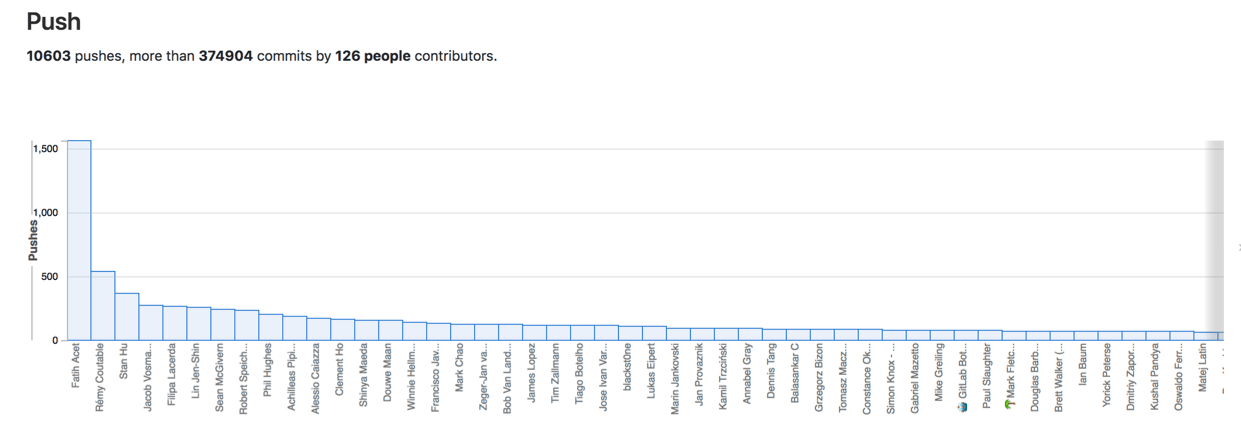
There are three main bar graphs that illustrate the number of contributions per group member for the following:
- Push events
- Merge requests
- Closed issues
Hover over each bar to display the number of events for a specific group member.
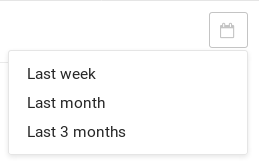
Changing the period time
You can choose from the following three periods:
- Last week (default)
- Last month
- Last three months
Select the desired period from the calendar dropdown.
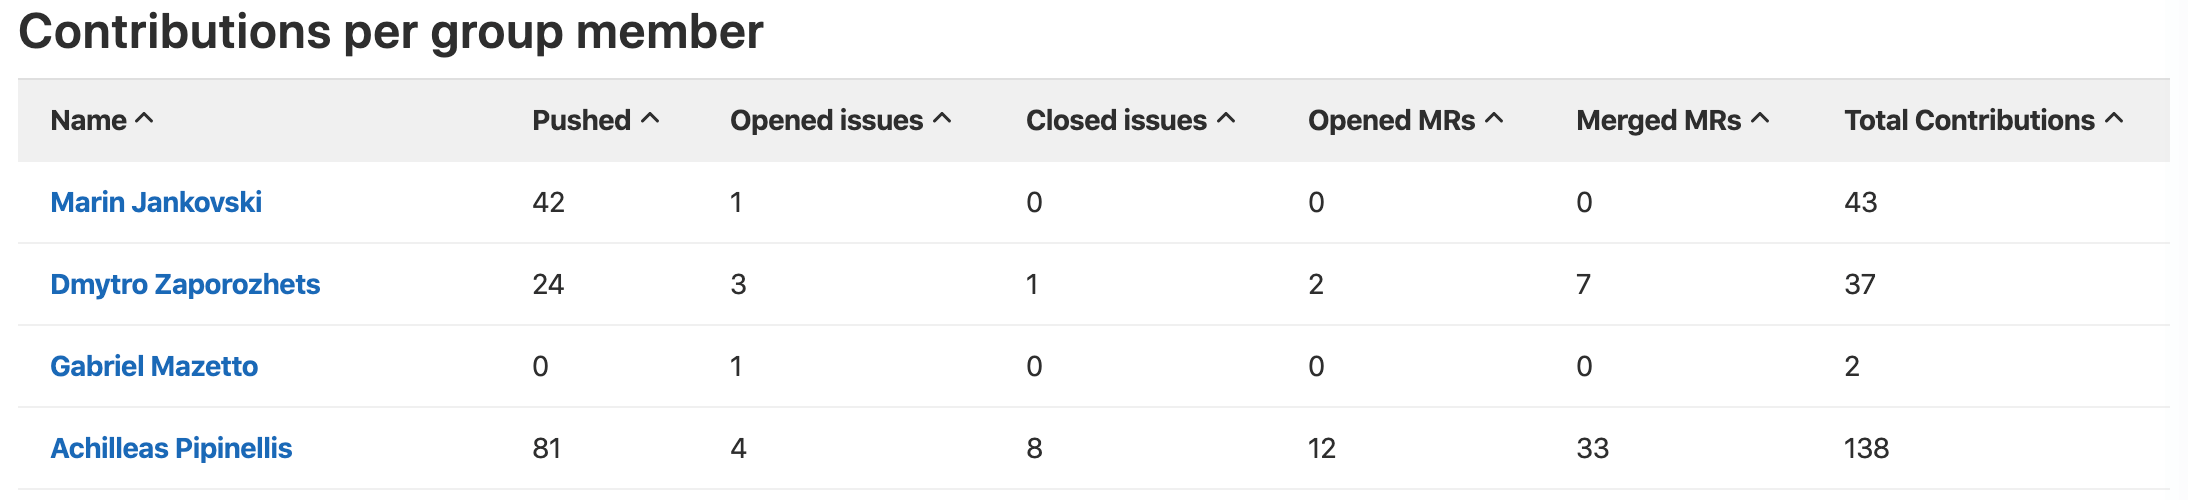
Sorting by different factors
Contributions per group member are also presented in tabular format. Select a column header to sort the table by that column:
- Member name
- Number of pushed events
- Number of opened issues
- Number of closed issues
- Number of opened MRs
- Number of merged MRs
- Number of closed MRs
- Number of total contributions