6.4 KiB
| stage | group | info |
|---|---|---|
| Monitor | Health | To determine the technical writer assigned to the Stage/Group associated with this page, see https://about.gitlab.com/handbook/engineering/ux/technical-writing/#designated-technical-writers |
Incident Management
GitLab offers solutions for handling incidents in your applications and services, such as setting up Prometheus alerts, displaying metrics, and sending notifications.
Configure incidents (ULTIMATE)
Introduced in GitLab Ultimate 11.11.
You can enable or disable Incident Management features in the GitLab user interface to create issues when alerts are triggered:
-
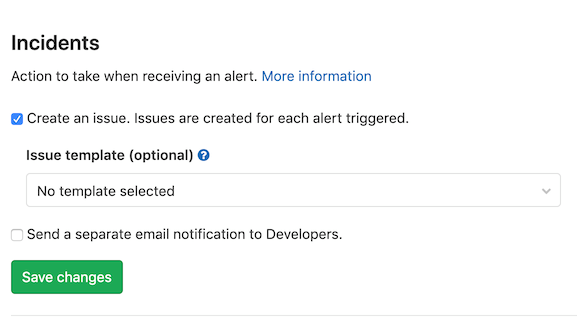
Navigate to {settings} Settings > Operations > Incidents and expand Incidents:
-
For GitLab versions 11.11 and greater, you can select the Create an issue checkbox to create an issue based on your own issue templates. For more information, see Trigger actions from alerts (ULTIMATE).
-
To create issues from alerts, select the template in the Issue Template select box.
-
To send separate email notifications to users with Developer permissions, select Send a separate email notification to Developers.
-
Click Save changes.
Appropriately configured alerts include an embedded chart for the query corresponding to the alert. You can also configure GitLab to close issues when you receive notification that the alert is resolved.
Notify developers of alerts
GitLab can react to the alerts triggered from your applications and services by creating issues and alerting developers through email. By default, GitLab sends these emails to owners and maintainers of the project. These emails contain details of the alert, and a link for more information.
To send separate email notifications to users with Developer permissions, see Configure incidents.
Configure PagerDuty integration
Introduced in GitLab 13.2.
You can set up a webhook with PagerDuty to automatically create a GitLab issue for each PagerDuty incident. This configuration requires you to make changes in both PagerDuty and GitLab:
-
Sign in as a user with Maintainer permissions.
-
Navigate to {settings} Settings > Operations > Incidents and expand Incidents.
-
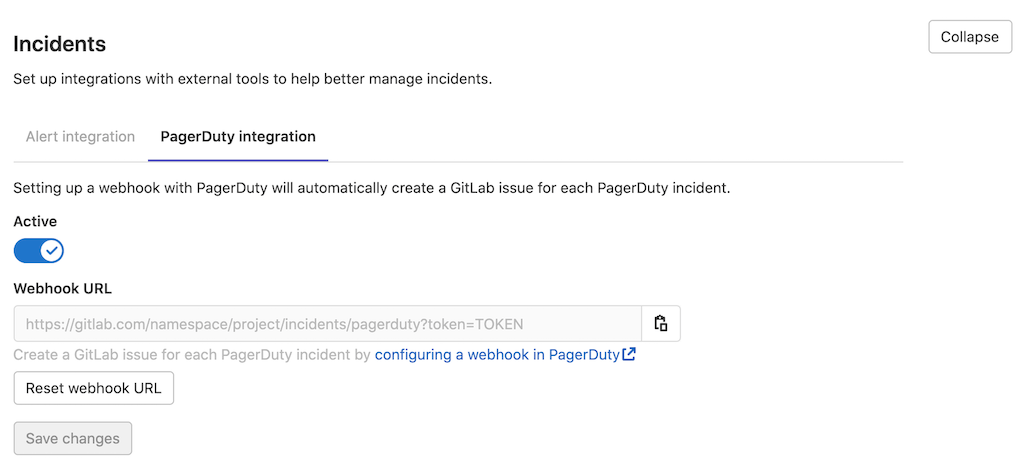
Select the PagerDuty integration tab:
-
Activate the integration, and save the changes in GitLab.
-
Copy the value of Webhook URL for use in a later step.
-
Follow the steps described in the PagerDuty documentation to add the webhook URL to a PagerDuty webhook integration.
To confirm the integration is successful, trigger a test incident from PagerDuty to confirm that a GitLab issue is created from the incident.
Configure Prometheus alerts
You can set up Prometheus alerts in:
- GitLab-managed Prometheus installations.
- Self-managed Prometheus installations.
Prometheus alerts are created by the special Alert Bot user. You can't remove this user, but it does not count toward your license limit.
Configure external generic alerts
GitLab can accept alerts from any source through a generic webhook receiver. When configuring the generic alerts integration, GitLab creates a unique endpoint which receives a JSON-formatted, customizable payload.
Embed metrics in incidents and issues
You can embed metrics anywhere GitLab Markdown is used, such as descriptions, comments on issues, and merge requests. Embedding metrics helps you share them when discussing incidents or performance issues. You can output the dashboard directly into any issue, merge request, epic, or any other Markdown text field in GitLab by copying and pasting the link to the metrics dashboard.
You can embed both GitLab-hosted metrics and Grafana metrics in incidents and issue templates.
Context menu
You can view more details about an embedded metrics panel from the context menu. To access the context menu, click the {ellipsis_v} More actions dropdown box above the upper right corner of the panel. The options are:
- View logs.
- Download CSV - Data from embedded charts can be downloaded as CSV.
View logs from metrics panel
- Introduced in GitLab Ultimate 12.8.
- Moved to GitLab Core 12.9.
Viewing logs from a metrics panel can be useful if you're triaging an application incident and need to explore logs from across your application. These logs help you understand what is affecting your application's performance and resolve any problems.
Integrate incidents with Slack
Slack slash commands allow you to control GitLab and view GitLab content without leaving Slack.
Learn how to set up Slack slash commands and how to use the available slash commands.
Integrate issues with Zoom
GitLab enables you to associate a Zoom meeting with an issue for synchronous communication during incident management. After starting a Zoom call for an incident, you can associate the conference call with an issue. Your team members can join the Zoom call without requesting a link.